Historical evidence-based implementation walkthrough
Historical COVID-19 Map and Data Dashboard — Technical Case Study
This case study examines a static browser project that requested location records and worldwide totals, then rendered Mapbox markers, popups, and DOM summary cards. It documents historical source code—not current pandemic statistics, medical guidance, service availability, or production performance.

Project at a glance
Application
Static HTML, CSS, and browser JavaScript
Map
Mapbox GL JS streets style with red markers
Data access
Two jQuery AJAX requests on document ready
Transformation
Location and worldwide fields mapped into browser output
Interaction
jQuery-controlled local media and embed slider
Evidence
Public source files and repository history
Evidence and time boundary
Technical claims follow the current files in the approved public repository. The source establishes a historical client-side implementation; it does not establish when original development occurred, whether the dashboard remains operational, or whether any displayed record is current. The repository publication date is not treated as the application delivery date.
Historical portfolio evidence only. This page does not provide present-day health data, public-health advice, or a claim that the former data endpoints are available.
Historical client architecture
The repository contains no application backend or database. A static page loads jQuery and Mapbox GL JS from external CDNs, runs two JSON requests, transforms response fields, and updates the browser. The map, summary cards, and media carousel are independent presentation paths inside that page.
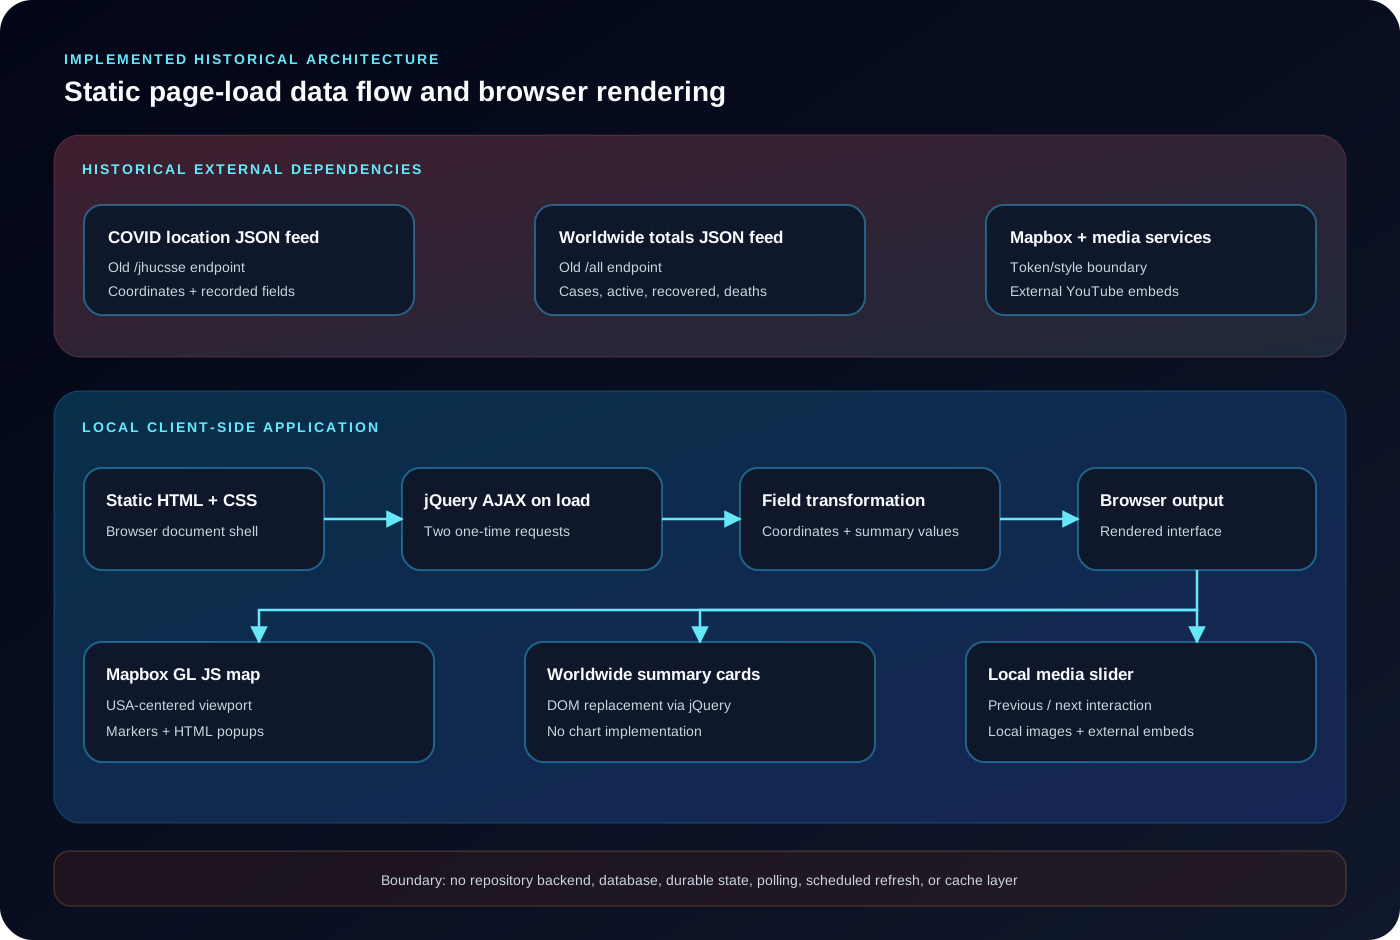
The diagram describes the inspected implementation. It does not imply a server-side API, database, durable queue, scheduled refresh, or cache layer.
Data-source boundary
The JavaScript references two historical corona.lmao.ninja paths: a JHUCSSE-shaped location feed and an aggregate worldwide feed. The location loop reads latitude, longitude, country, province, confirmed, recovered, and death fields. The aggregate request reads cases, active, recovered, and deaths. Response timestamps are not displayed or compared with browser render time.
The upstream Johns Hopkins CSSE COVID-19 dashboard stopped collecting and reporting global cases on March 10, 2023. This implementation is therefore a record of an earlier data-visualization approach—not a source for present conditions.
Request and freshness lifecycle
Both AJAX requests run once inside document ready. There is no evidenced polling interval, manual refresh action, service worker, scheduled ingestion, cache revalidation, or source-time label. “Loaded on page open” is the precise behavior; the source does not justify describing the dashboard as live or real-time.
Map and token boundary
Mapbox GL JS creates a streets-style map centered at longitude -96 and latitude 37.8 with zoom level 3. Each location record becomes a red marker and HTML popup. Although the viewport is centered on the United States, the loop uses country and province records from the feed; the source does not establish a state-only USA dataset.
The repository contains a placeholder where a Mapbox access token must be supplied. A configured token is required for normal map rendering, while restriction and rotation remain deployment responsibilities. No token or private value is reproduced here. Review the official Mapbox access-token guidance.
Markers and summaries—not charts
The browser creates map markers and popup HTML for location records, while a separate request replaces the summary bar with four worldwide values. No charting library, plotted time series, or Leaflet implementation appears in the inspected application path. README references to Leaflet and charts are therefore not presented as implemented features; source files and loaded dependencies take precedence.
Media slider boundary
Previous and next controls change the visible item within a small browser-side collection built from local images and external YouTube embeds. This demonstrates basic jQuery UI state, not a media pipeline. The assets and embeds should receive provenance, licensing, relevance, and privacy review before broader portfolio reuse; none is reproduced here.
Failure and security boundaries
Map configuration
A missing or invalid token prevents the intended map path from rendering normally.
Location request
No error callback, retry, timeout, loading, empty, or user-facing fallback state is evidenced.
Totals request
Failure can leave the summary area without requested values; no recovery contract is present.
Freshness
The UI does not expose source timestamps or distinguish source time from render time.
Popup content
Third-party strings enter Mapbox setHTML without an explicit escaping boundary in the inspected code.
Observability
Tests, structured logs, telemetry, alerts, and operational runbooks are absent.
The popup observation is a review boundary, not a claim that an exploit was demonstrated. Safe text construction and validated upstream fields would be appropriate modernization work.
Safe source excerpts
These excerpts preserve public implementation provenance without reproducing tokens, health records, media identifiers, or private configuration.
Map configuration
js/main.js
var map = new mapboxgl.Map({
container: 'map',
style: 'mapbox://styles/mapbox/streets-v11',
center: [-96, 37.8],
zoom: 3,
});
Demonstrates the map viewport and style boundary; it does not establish token configuration, availability, or current data.
Location-field transformation
js/main.js
var lat = data[i].coordinates.latitude
var long = data[i].coordinates.longitude
var country = data[i].country
var confirmed = data[i].stats.confirmed

new mapboxgl.Marker({
draggable: false,
color: "red",
})
  .setLngLat([long, lat])
  .setPopup(popup)
  .addTo(map);
Demonstrates response-field mapping into markers; it does not prove coverage, accuracy, safe popup encoding, or coordinate quality.
Worldwide summary request
js/main.js
$.ajax({
  url: "https://corona.lmao.ninja/v3/covid-19/all",
  type: "GET",
  dataType: "json",
  success:function(allData){
    var globleActive = allData.active
    var globleCases = allData.cases
    var globleDeaths = allData.deaths
    var globleRecovered = allData.recovered
  },
});
Demonstrates a separate aggregate request and selected fields; it does not prove endpoint health, refresh cadence, or present-day values.
Repository hygiene
The tree has no package manifest, lockfile, automated tests, CI workflow, build configuration, deployment configuration, or license file. README instructions also refer to a different clone identity and directories not found in the inspected tree. Before portfolio reuse, documentation should be reconciled with source, third-party assets reviewed, dependencies made reproducible, and licensing made explicit.
What the public evidence proves
| Evidence | Demonstrates | Does not prove |
|---|---|---|
| HTML/CSS/JavaScript source | A static browser interface | Production deployment, traffic, or accessibility |
| Two AJAX calls | Client-side JSON retrieval on page load | Current data, endpoint health, or continuous refresh |
| Mapbox marker loop | Coordinate transformation and popup rendering | Coverage, accuracy, or safe content handling |
| Summary DOM update | Worldwide fields rendered as cards | Charts, time-series analysis, or medical interpretation |
| Media controls | Previous/next browser interaction | Asset licensing, privacy, or a media platform |
| Public repository | Inspectable historical implementation | Commercial success, outcomes, uptime, or scale |
What the evidence does not establish
- A live or real-time monitoring service
- Current, complete, or medically authoritative statistics
- A backend, database, cache, or scheduled ingestion system
- Leaflet, charts, time-series analysis, or geographic analytics
- Measured speed, accuracy, reliability, scale, uptime, or SLA
- Production adoption, business outcomes, or client results
How I would modernize it today
Future recommendations—not historical implementation claims
- Select maintained datasets and show source timestamps and archival status in the UI.
- Add loading, empty, partial, timeout, and retry states for every external dependency.
- Move normalization behind a typed server boundary when caching or policy control is required.
- Render untrusted text through safe DOM APIs instead of assembling popup HTML.
- Use restricted environment-managed Mapbox tokens and document rotation policy.
- Add schemas, deterministic fixtures, tests, accessibility checks, and CI.
- Reconcile README claims and review every image and embed for licensing and privacy.
- Add monitoring only for an operated service, with honest freshness and availability labels.
What this project demonstrates
The public source demonstrates static interface construction, client-side JSON requests, response-field transformation, Mapbox marker and popup composition, jQuery DOM updates, and a small media interaction. Its portfolio value is the inspectable browser data flow and modernization lessons—not unsupported current-data or outcome claims.
Review the historical implementation
Inspect the public source, return to the portfolio, or compare this static client boundary with other evidence-based case studies.